With all the MFA-earning, Book-promoting, and Day-job-having, I still managed to apply myself to submitting new material for publication, with the usual result of a wealth of data to fuss over instead of writing! Yay! Let’s get to the particulars.
Poetry:
I submitted individual poems 72 times for 3 acceptances, which makes an acceptance rate of just about 4% – my second-lowest non-zero acceptance rate for poetry since I started counting, but I am pleased with it because I met my goal of submitting more poetry after last year’s crushing zero poetry sales. This was my most poems submitted in a year since 2018! (Okay, it beat 2019 by one.) And as you can see, it paid off:
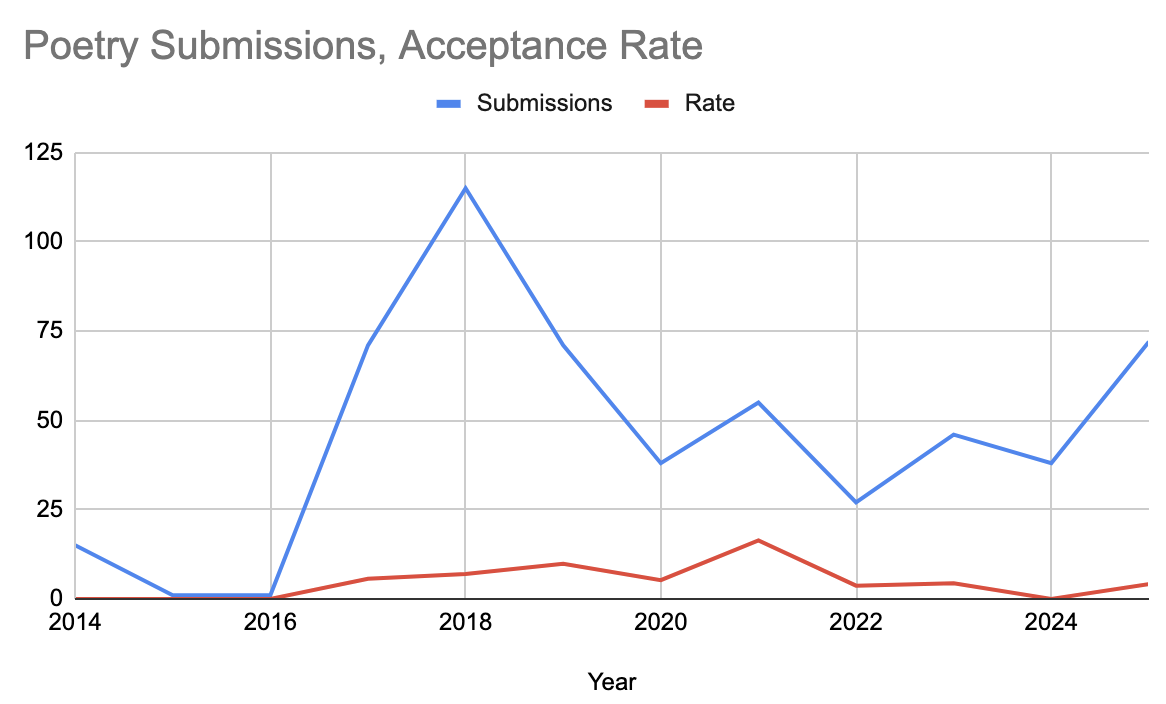
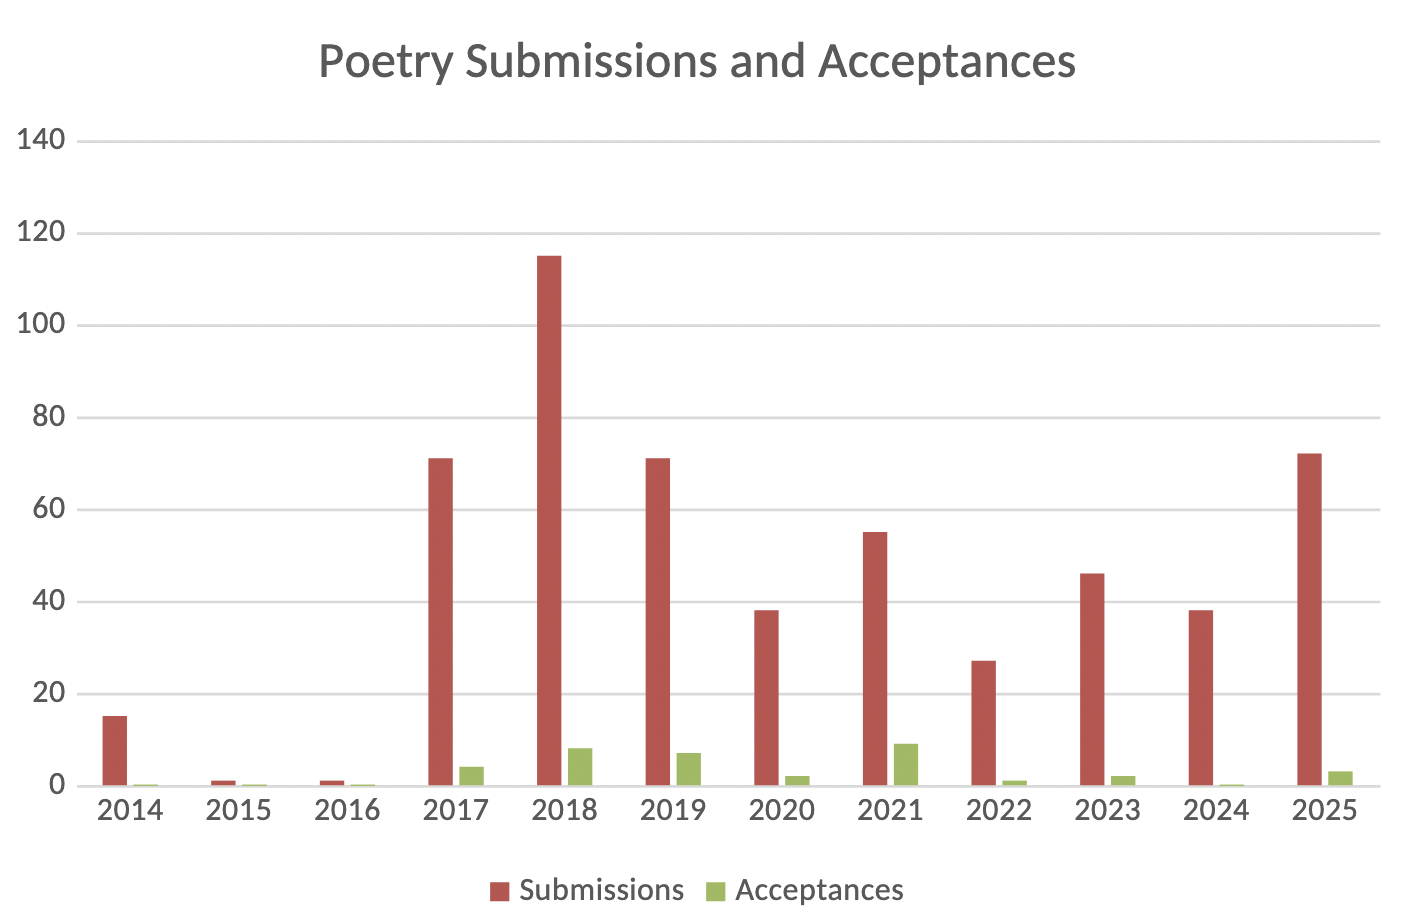
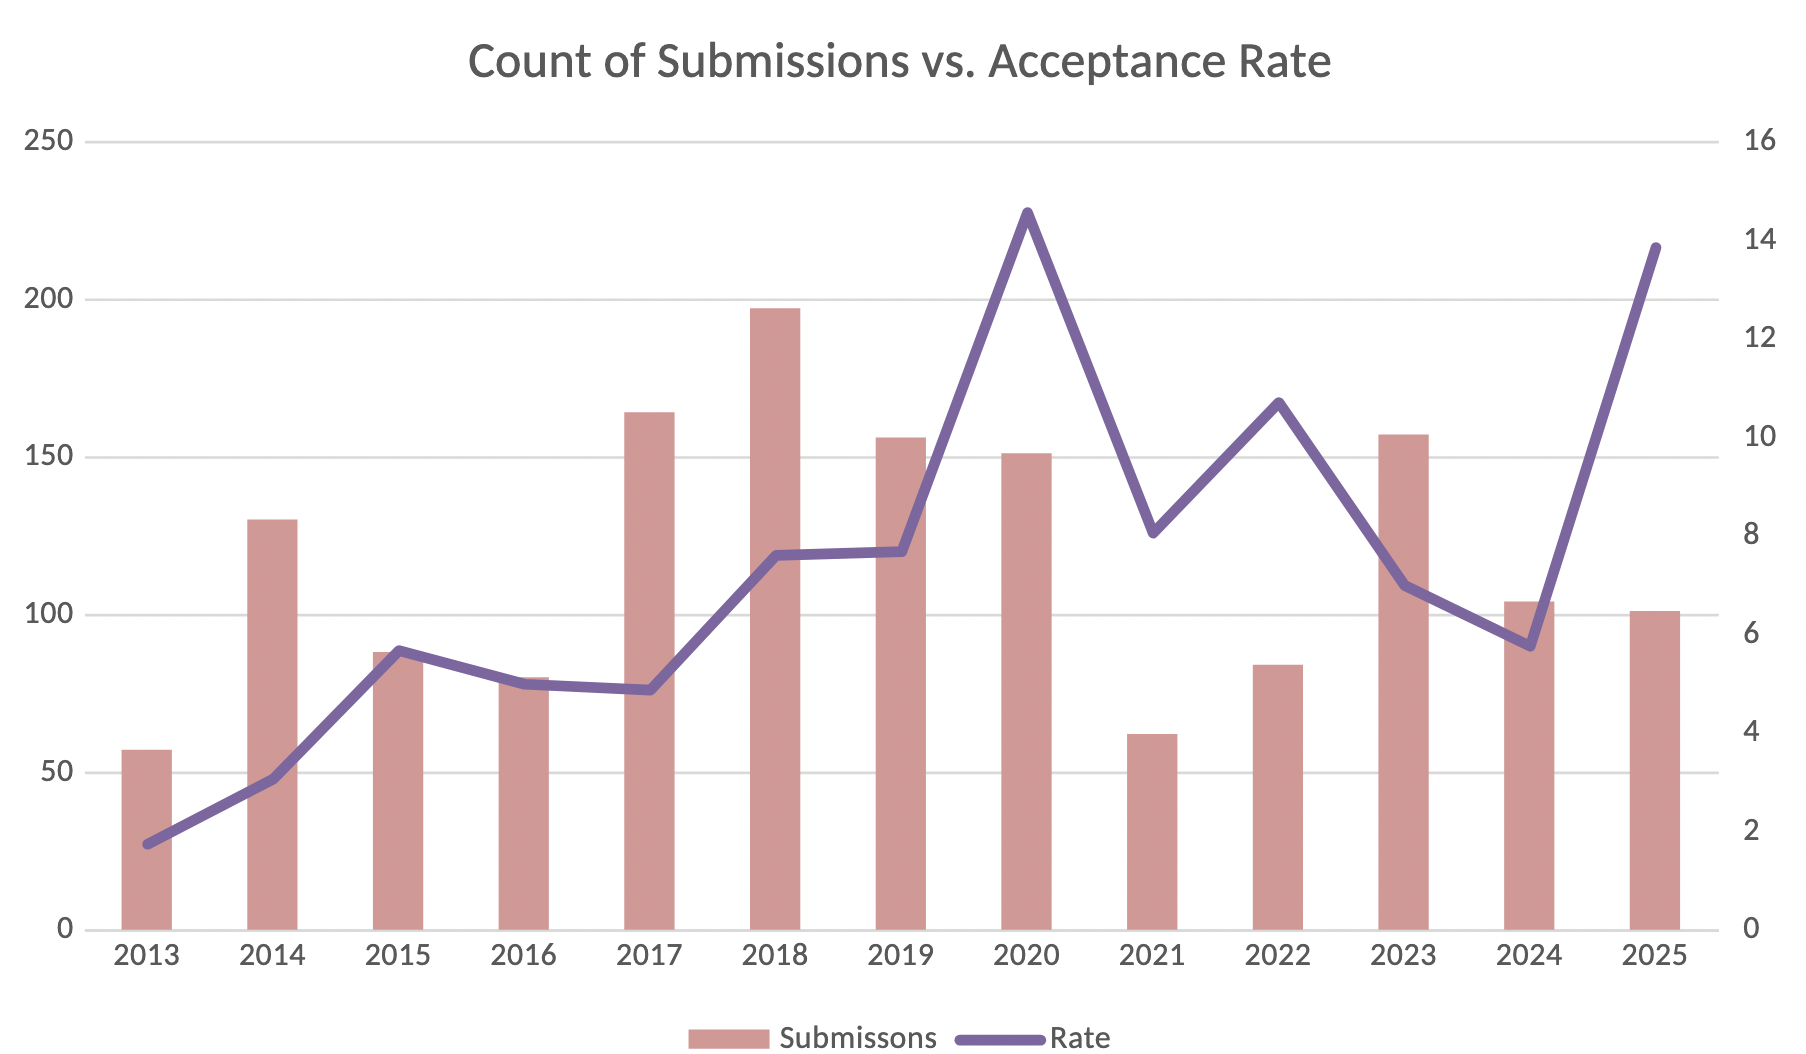
I quit MS Office this year, and I’m still learning how to wrangle Libra Office for spreadsheets and charts, so just imagine this had the rate with its own Y-axis, and the submissions were in bars like in my old excel graph, included here to show the acceptances next to total submissions:
New Category! Book-Length Poetry:
I submitted three poetry chapbook manuscripts 11 times for 1 acceptance. That’s a very statistically suspect acceptance rate of 10%. (Yay! My first poetry chapbook is coming out! I may make another blog post just about the process of finding 11 places to submit poetry manuscripts. It was not easy.)
Short Stories:
As usual, my goal was to hit 100 submissions for the year, and I did! 101 submissions for 14 acceptances, an acceptance rate of just under 14%! This is my highest acceptance rate since 2020, and second-highest ever! Yay! The slump is over!
(Or predictions based on a subjective business are foolhardy at best. Shh. I know.)
Next year’s goal: don’t be sad when the line goes down again like it did in 2021.
Novels
I have been loathe to talk about my novel submissions. It’s a scary, bleak world for novel submissions. But perhaps being more open about my attempts will help me work more regularly at querying.
Agent Queries: This year, I queried 17 agents for 14 form rejections, one full req that became a rejection, and 2 never responded. This is down from 28 agents queried in 2024, though I didn’t get any full or partial requests last year.
Acceptance rate sits at its consistent 0%.
Direct Submissions of Books to Publishers:
1 for Mot the Stupid, to Flame Tree – haven’t heard back.
2 for Multitude, first to Tor, which I screwed up by not knowing how to send it, and then to Apex, who accepted it!
The numbers are so small, it’s silly to make a chart? Acceptance rate 50%?
Some day I’ll get that query acceptance rate to not be zero. I’ve only been querying agents for (checks notes)… twenty years.
I hope next year to query at least 25 agents, if I can find any that haven’t rejected me already in the past three years. They make new agents all the time, right?