I recently re-read an old blog post I did on my rejection statistics for sold stories. I had sold 9 stories at that time (March of 2016) and averaged 10.1 rejections on sold stories, with 22 highest rejections and 4 lowest.
How has that changed now that I’ve sold 40 stories?
For one thing, I’m using The Submission Grinder to track my submissions now, instead of an excel spreadsheet, and my submission rate has grown. I sent out 104 submissions so far this year, compared to 80 submissions in all of 2016.
First discovery: the number of sales per year chart looks pleasantly similar to the number of submissions per year, which feels like a correlation– more submissions, more sales:
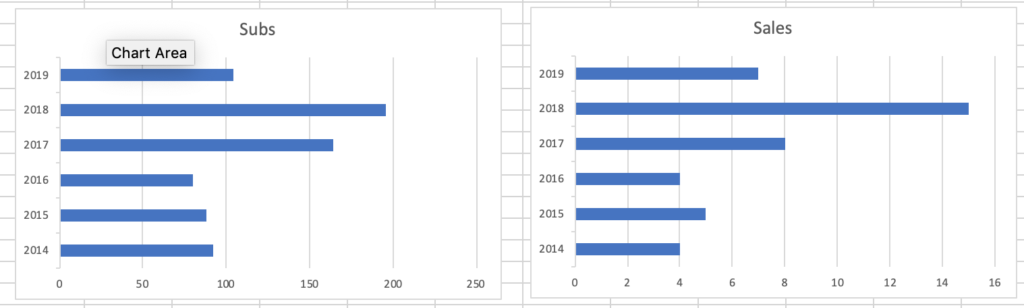
(I really want to be able to overlap those with each other but my Excel-fu is not strong.)
When I totaled up how many submissions I had made of each story I had sold and calculated the average, it came out the same as last time – at least the same to one decimal place: 10.1.
Initial hypothesis: at 40 short story sales, I am getting the same number of rejections on average as I did at 9 short story sales.
I threw down a trendline. I won’t bother to show it to you, it was almost perfectly horizontal. The trend is: the trend will continue.
There are a few outliers. I’ve sold 3 stories to the very first market I sent them to, now, something I hadn’t done in 2016, and I have one story that punches the sky at 36 rejections (this was just three story sales after the 2016 9.)
So I took the median instead of the average, and found it to be: 9! Yay a round number! Also exciting that the median is lower than the average. I mean, for me, who wants to have as few rejections as possible per acceptances. Median calculation balances the influence of outliers, those points of data that are way off from the norm.
Was there no change at all in my submission success? I took the median of just the first 20 stories and found it to be 7.5, whereas the median for the last 20 stories was 9.6. So I am trending more rejections per sale as time goes on! Actually, that’s exactly what you’d expect, because the longer I track my submissions, the more old stories I have. When I first started tracking, all stories started out with 0 rejections recorded. My most recent story sale had 21 submissions before selling.
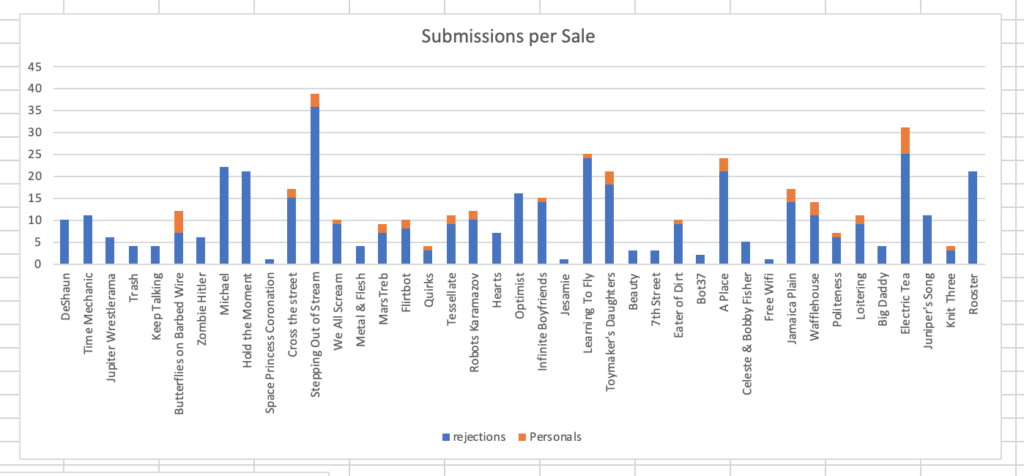
I also marked personal rejections on that chart and you’ll see there is a clear correlation between stories that are sent out more getting more personal rejections. The longer lines are the ones with orange tips.
All of this seems to imply that there’s nothing changing, nothing about my writing that’s getting better (or worse) that it’s just a numbers game. Submit more, sell more.
The average number of personal rejections I got was 1.1 overall. Median? 0. Ouch. Well, there were a lot of stories that never got personal rejections. I split it into first and last 20 and got some positive news. Median went from 0 to 1. Average went from 1.1 to 1.2. So yes, I am getting slightly more personal rejections as time goes on.
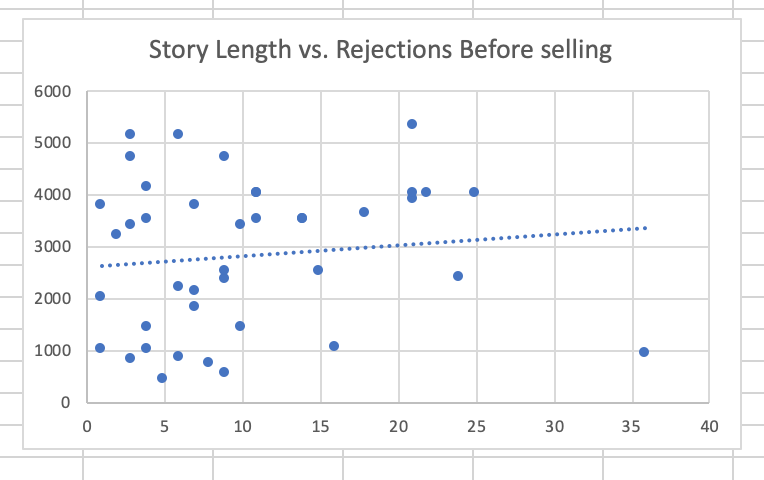
For giggles, I then plotted story length by number of rejections before sale and found a very very slight trend toward longer stories getting more rejections before selling but it’s not awesomely correlated:
However, if I delete the outlier – my 1000 word story that got 36 rejections before selling, the correlation is much stronger:
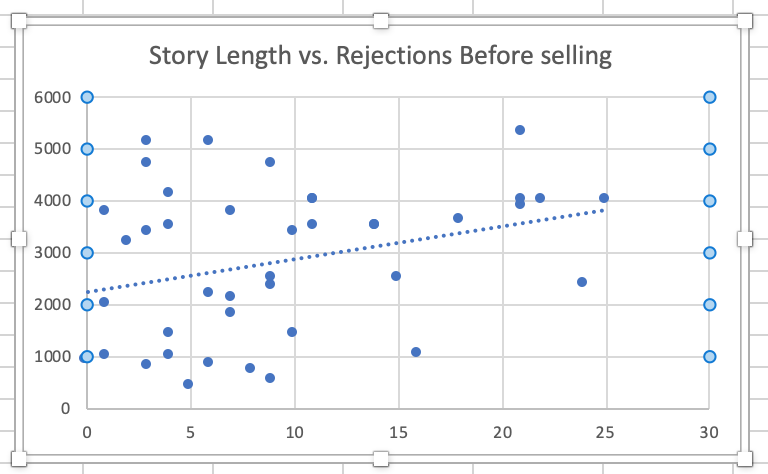
I had this gut feeling that my shorter pieces sold better and this seems to back that up.
The shortest story I have ever sold was just 480 words long, the longest is the one I just sold at 5,300 words long. My average story length is 2,828 words, the median 3,400.
SO… all these stats are only concerning stories that sold. There could be suvivorship bias in there. It’d be interesting to see how many rejections my average unsold stories have now and compare. So I looked at the 30 short stories I am currently shopping around– the current “Trunk”.
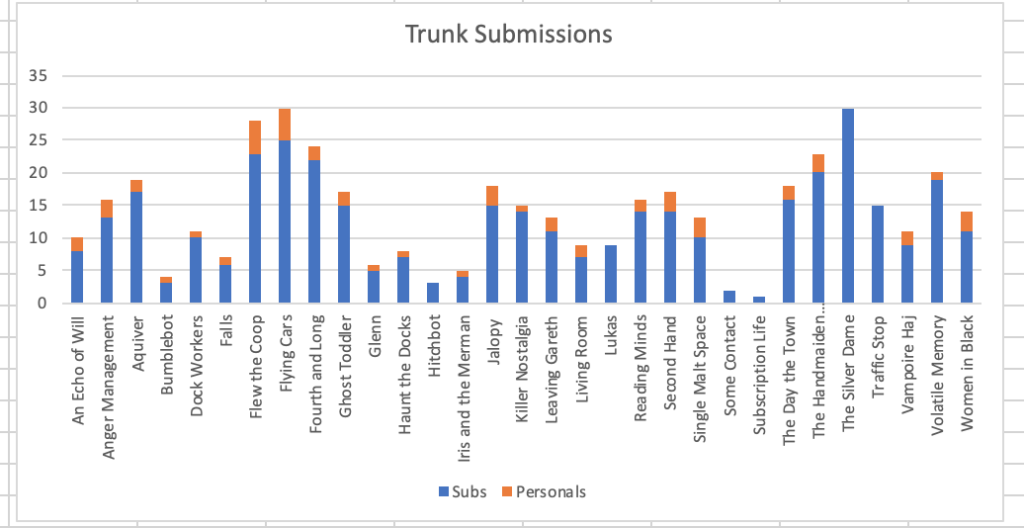
First observation: as expected, unsold stories have more submissions on average (12.2) than sold (10.1) The median is 11 (as opposed to 9 for sold stories). This isn’t surprising… stories that don’t sell get sent out again, so sold stories would tend to have fewer submissions behind them. I got to stop counting.
Second observation: my unsuccessful babies have more personal rejections. Averaging 1.7 personal rejections per story and a median of 2 per story! Only five of the stories in the current trunk have not received a personal rejection, compared to over half of my sold stories.
This seems counter to the idea that personal rejections are a sign that a story is ‘close’ and may sell soon. Rather it feels like the close stories just stay out there gathering more personals. Perhaps stories that are rejected for reasons other than quality (not a good fit for the length of the issue, too many stories that already have robots in them, etc) are less likely to have that fact pointed out in a personal rejection.
Since I looked at wordcounts on sold stories, let’s look at wordcounts on unsold stories. This could be telling. Do shorter stories sell better?
Signs point to “maybe.” The stories I’m struggling to sell are longer. The median length for a story I’ve sold (40 data points) is 3,400 words. The median length for a story I’m still trying to sell (30 data points) is 3,600 words. Sold stories average 2,828 words and unsold average 3,375 -the averages are further apart than the medians. In both instances the median is larger than the average, which means the outliers are the smallest stories. (Which makes sense, flash pieces are not a large percentage. Four out of 30 unsold pieces are less than or equal to 1,000 words long, and 8 out of the 40 sold stories.)
Now, these stories include one that I just sent out for the first time this week and one that is on its 30th submission, but there is still a trend that longer stories have been submitted more times:
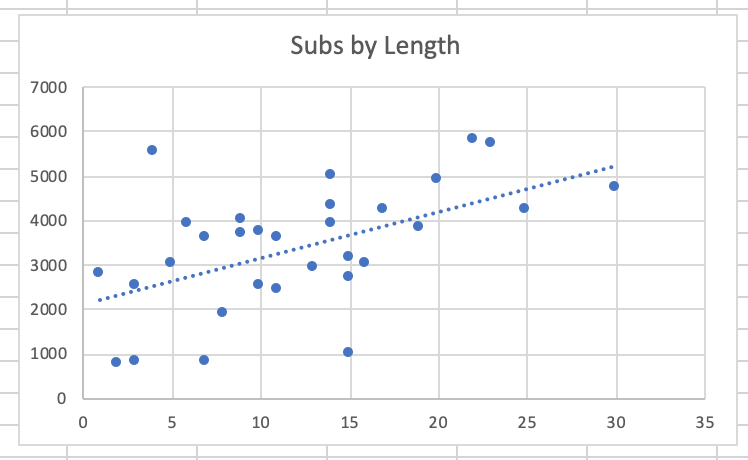
My longest trunk story is 5,700 words long and the shortest is 740. There are definitely more stories over 5k in the hopefuls than in the successful. I guess I should stop trying to write longer, huh? (A friend of mine is always insisting I need to take more time and lengthen my stories so I have been trying to. A useful exercise, but not necessarily a way to get a large amount of story sales.)
And now I have successfully wasted a few hours crunching numbers when I could have been writing! At least it distracts me from waiting to hear back on my current submissions. (I have 19 stories out in various editor’s inboxes as I write.)